Technical Service Reference · Anonymized
When Filter Settings Did Not Reduce Emissions: Tracing the Duct Leaks
The team avoided blaming the bags when the data behaved the wrong way—and used the contradiction to find hidden leakage paths.
On a high-temperature kiln tail-end baghouse, emissions varied with operating state. The key clue was counterintuitive: a higher pressure-drop setting and more dust coverage did not improve the reading, while compartment checks showed no evidence of dust bypass within the bag chambers.
Source and role: This technical-service reference is based on an anonymized record from the factory that manufactures filter bags supplied through Pinnacle Filter. Pinnacle Filter was not the original supplier to, or the on-site service provider for, the end user.
The operating problem
Emissions data rose when the filtration layer should have improved
The factory service team tested individual compartments and observed clean internal surfaces with no visible dust escape. Lower cleaning pressure and longer cleaning intervals increased the reading rather than reducing it. This reversed response pointed away from filter efficiency and toward leakage elsewhere in the collector or ductwork.
Field evidence trail
The observations that changed the diagnosis
The operating-state response was reversed
The reported value was around 14 mg/Nm³ with the raw mill running, but fluctuated more and sometimes exceeded 30 mg/Nm³ when it stopped.
Why it mattered: The change did not behave like a simple loss of filter efficiency.
More dust coverage did not help
Raising differential pressure from roughly 400–500 Pa toward 700–800 Pa increased the reported value instead of reducing it.
Why it mattered: A denser surface dust layer should not worsen a true filtration-efficiency problem in that direction.
No single compartment changed the signal
Compartments were closed individually for more than ten minutes without a corresponding reduction; longer isolation could increase the reading.
Why it mattered: The checks did not identify one leaking bag chamber as the source.
The clean side stayed visibly clean
Open-compartment inspection found no visible dust escape at the tube sheet, cages, blow pipes or clean-side surfaces.
Why it mattered: The visual evidence supported moving the investigation outside the bag chambers.
Cleaning changes moved the reading the wrong way
Lower cleaning pressure and longer cleaning intervals were associated with a higher—not lower—reported value.
Why it mattered: The contradiction reinforced the need to inspect the collector body and ductwork.
Shutdown inspection found the leak paths
A later shutdown inspection identified multiple duct leakage points, including three principal escape paths.
Why it mattered: The physical findings confirmed the direction of the field diagnosis.
How the factory service team worked
Evidence first. Recommendation second.
Compare operating states
Record the emissions response with the raw mill running and stopped, alongside pressure-drop changes.
Isolate compartments
Close compartments one by one long enough to look for a corresponding change in the reading.
Escalate the test
Recommend fluorescent-powder leak detection and a duct inspection during the next shutdown.
Diagnostic decision
What was ruled out—and what was confirmed
Findings that did not fit the initial assumption
- Insufficient filtration efficiency was inconsistent with the reversed pressure-drop and cleaning response.
- A single leaking compartment was not supported by the compartment-isolation checks.
- Visible dust bypass inside the clean-side chambers was not found during inspection.
- The monitoring value alone was not used as proof that the filter bags had failed.
Confirmed direction
Leakage paths were located in the ductwork, outside the bag chambers
The team used contradictory operating data to redirect the investigation. The subsequent shutdown inspection located multiple duct leaks and identified three as the principal escape paths, confirming that replacing functioning bags would not have addressed the actual problem.
Field photo evidence
Leak locations first—then the checks that ruled out the bag chambers
The confirmed duct leakage points are shown first with the original red problem-location outlines restored. Clean-side and pulse-pipe photographs follow as evidence from the earlier compartment checks.
Red outlines: problem locations reproduced from the original service-meeting deck.
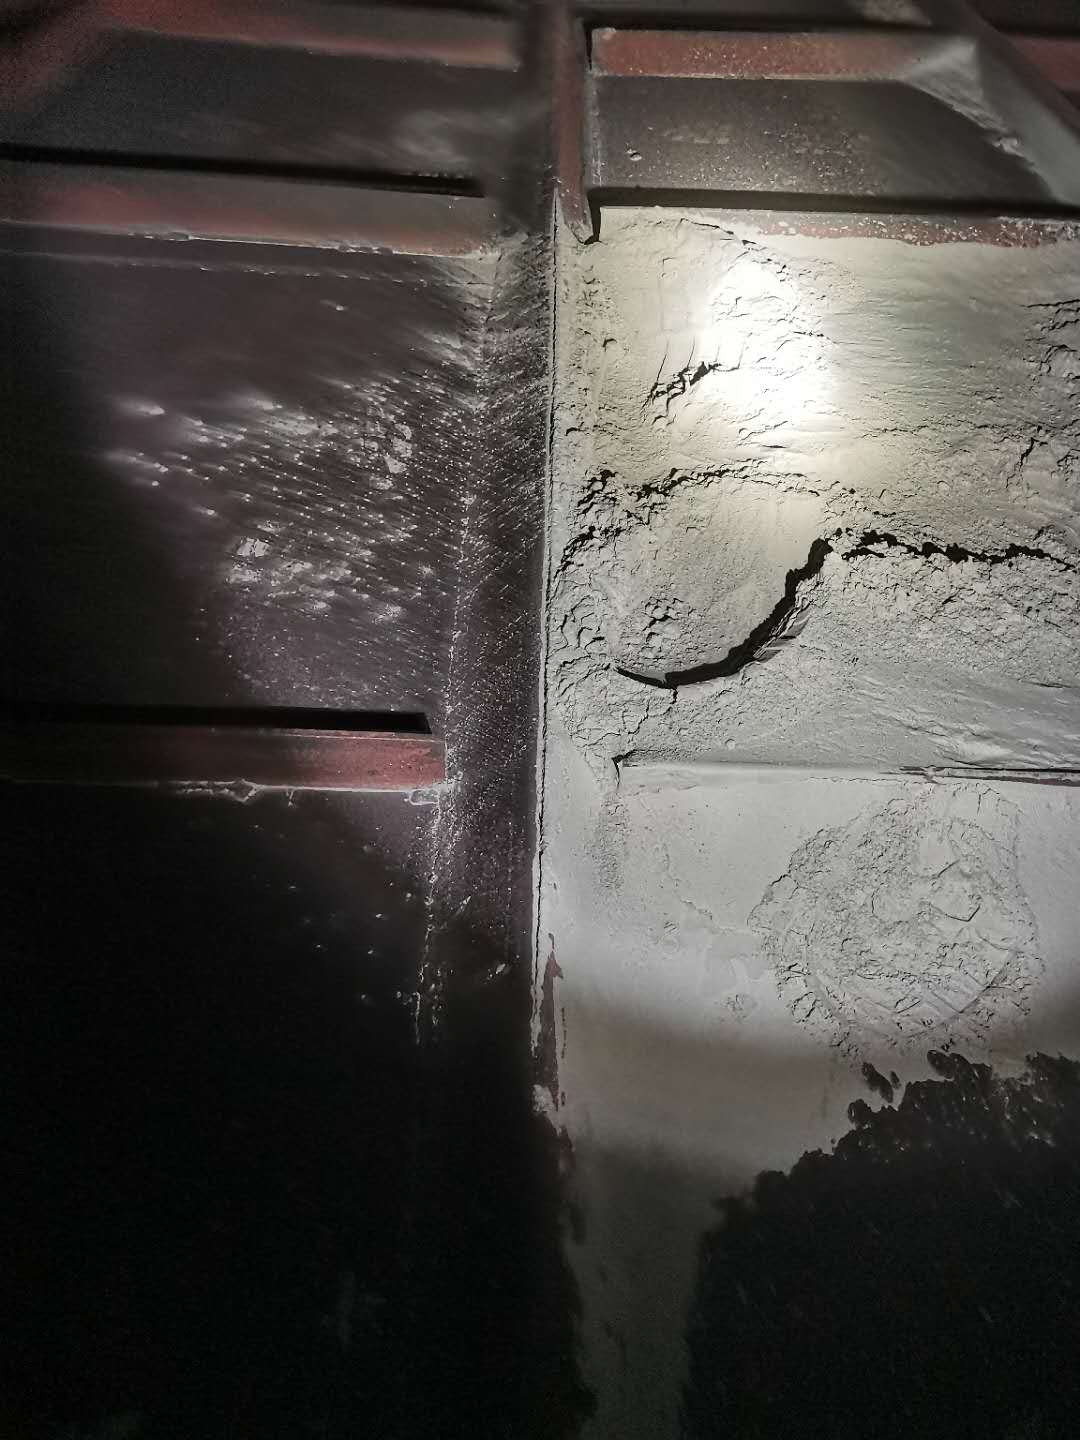
A second confirmed leakage path along a duct seam or adjoining surface, marked as in the original service record.
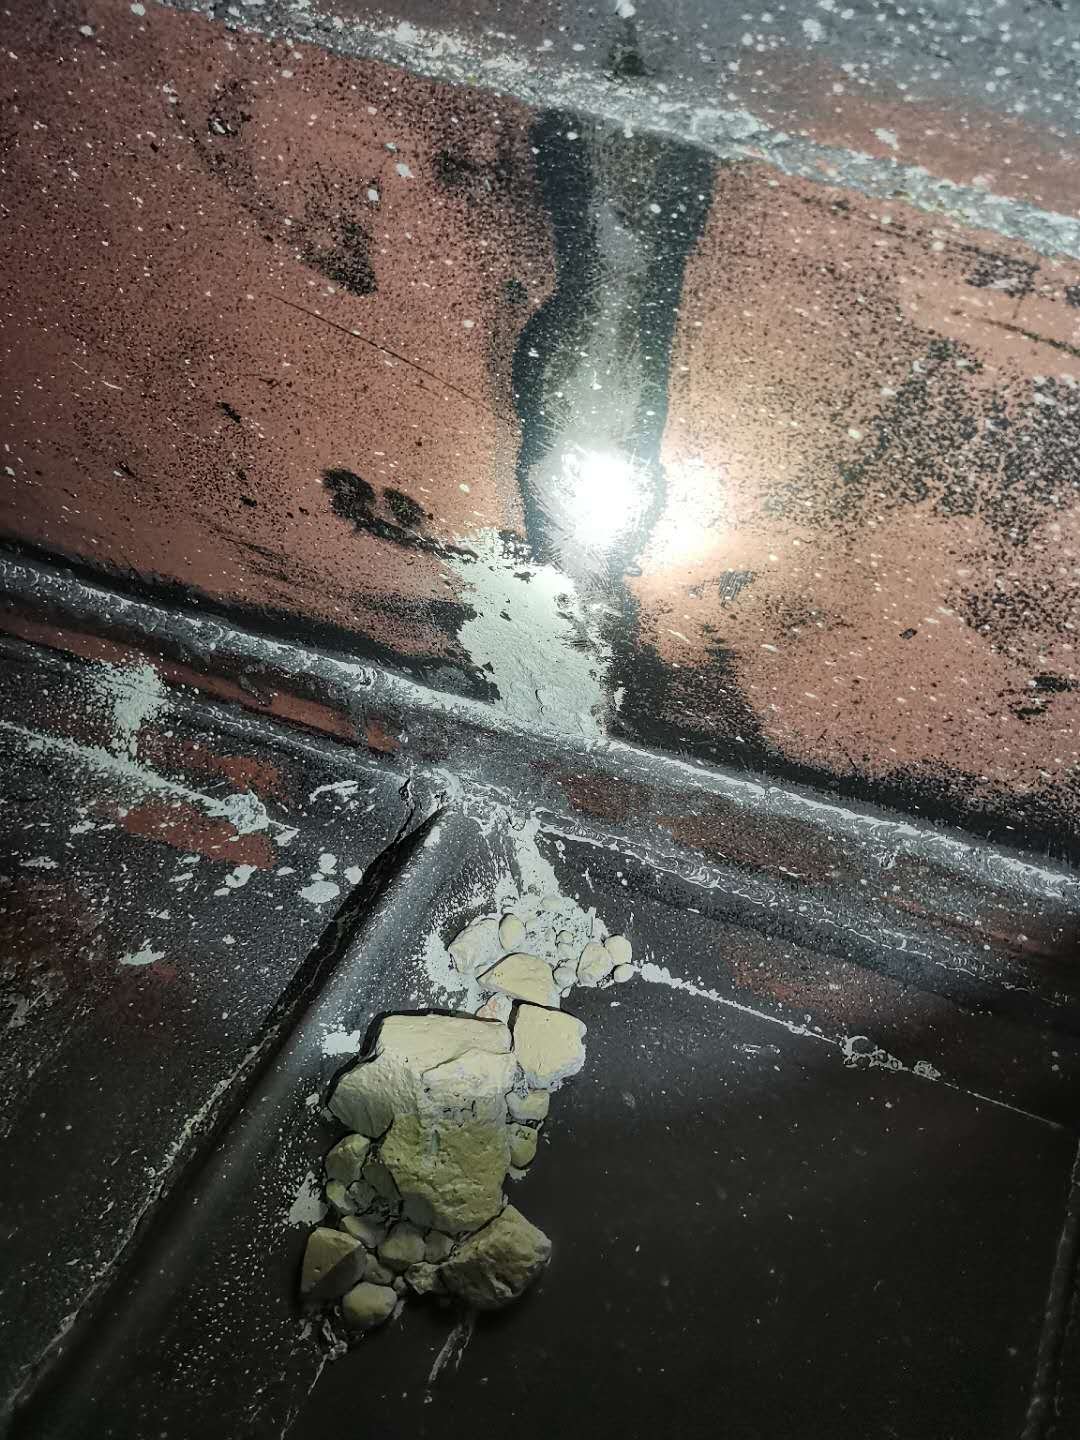
Dust accumulation at another confirmed leakage path; the red outline reproduces the original problem-location mark.
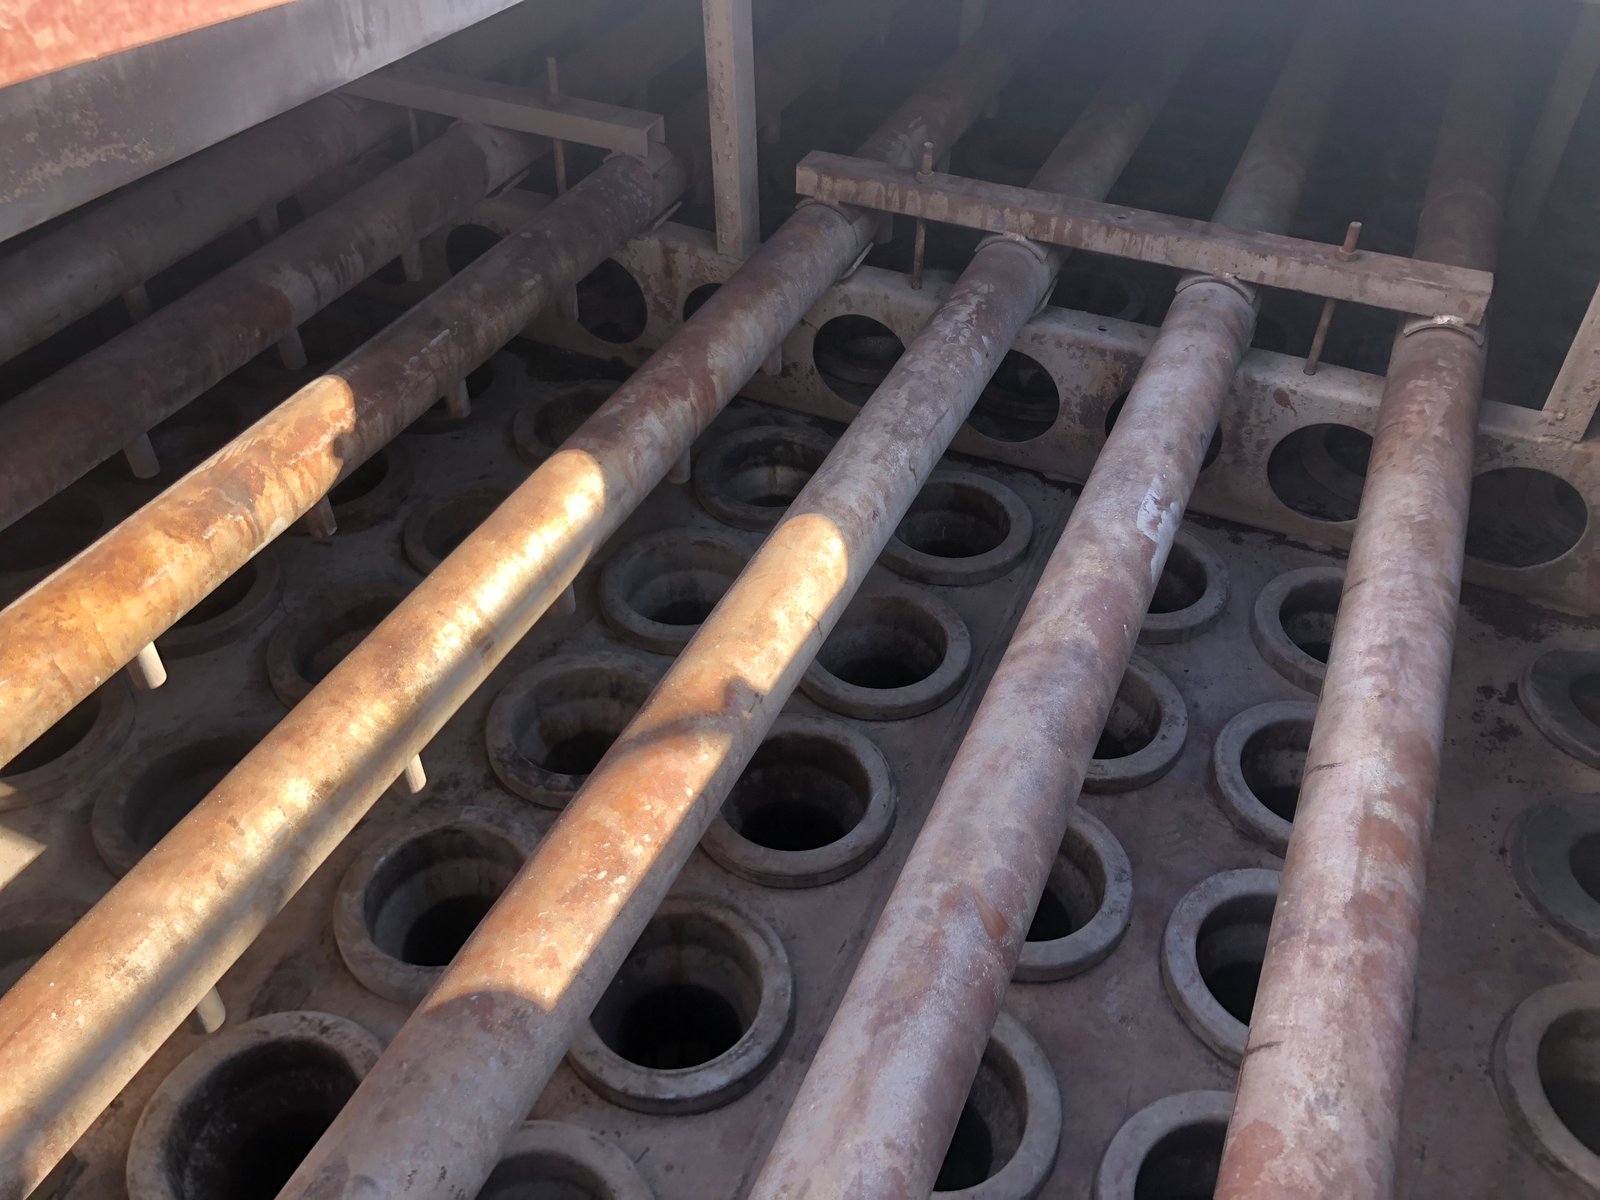
Blow pipes and tube-sheet openings were inspected for visible dust escape or obvious displacement.
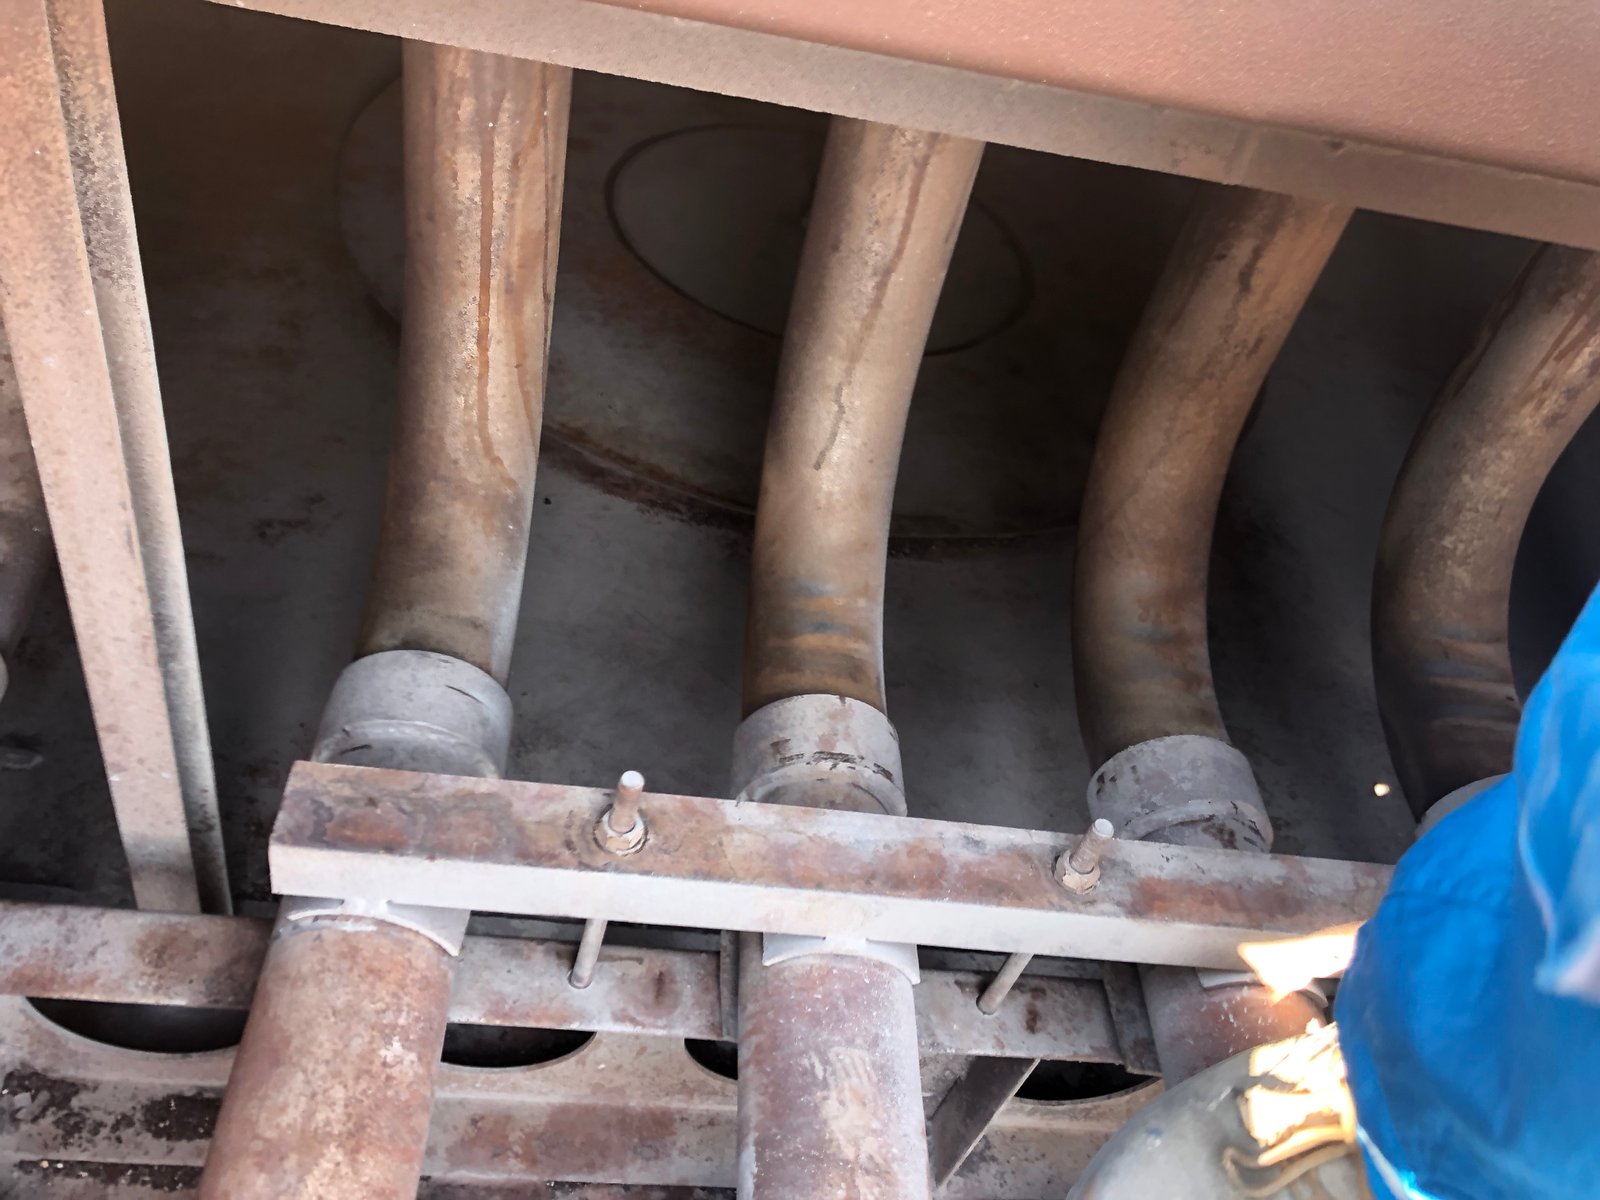
The pulse-cleaning pipework and surrounding clean-side surfaces were checked before the investigation moved to the ductwork.
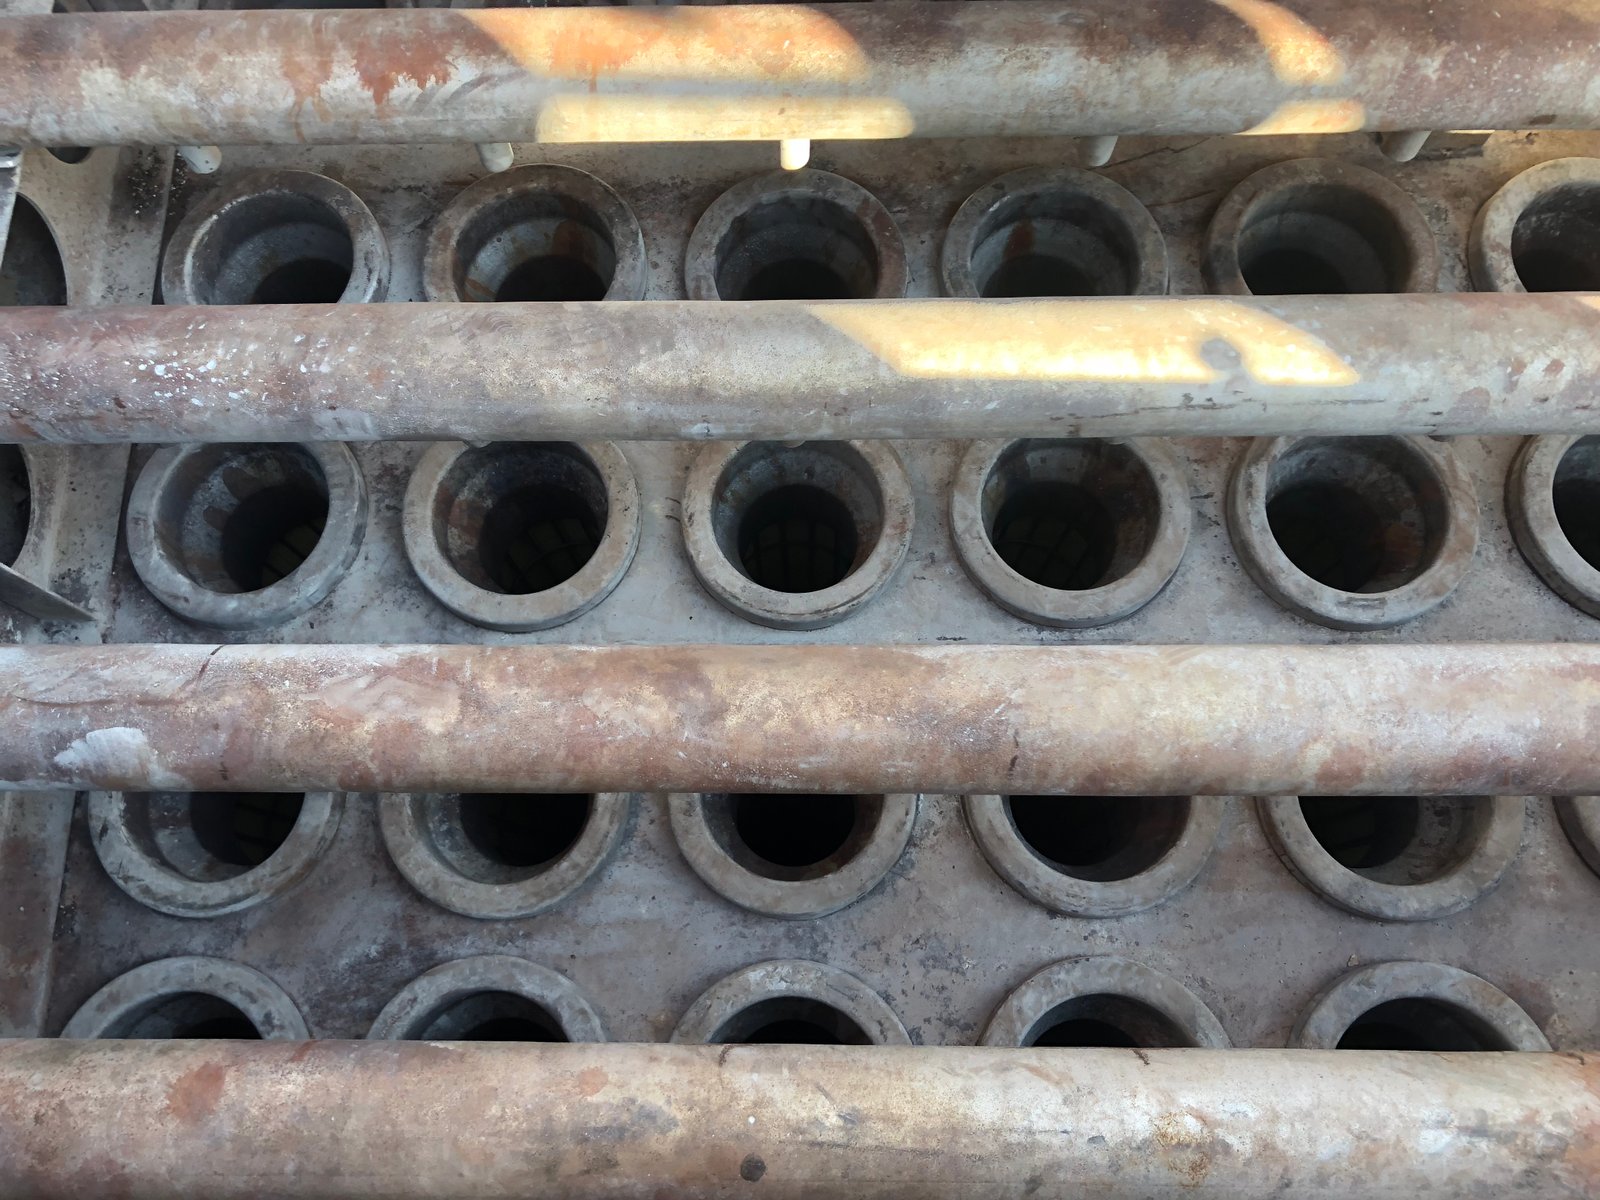
Clean-side inspection found no visible dust escape in the bag chambers.
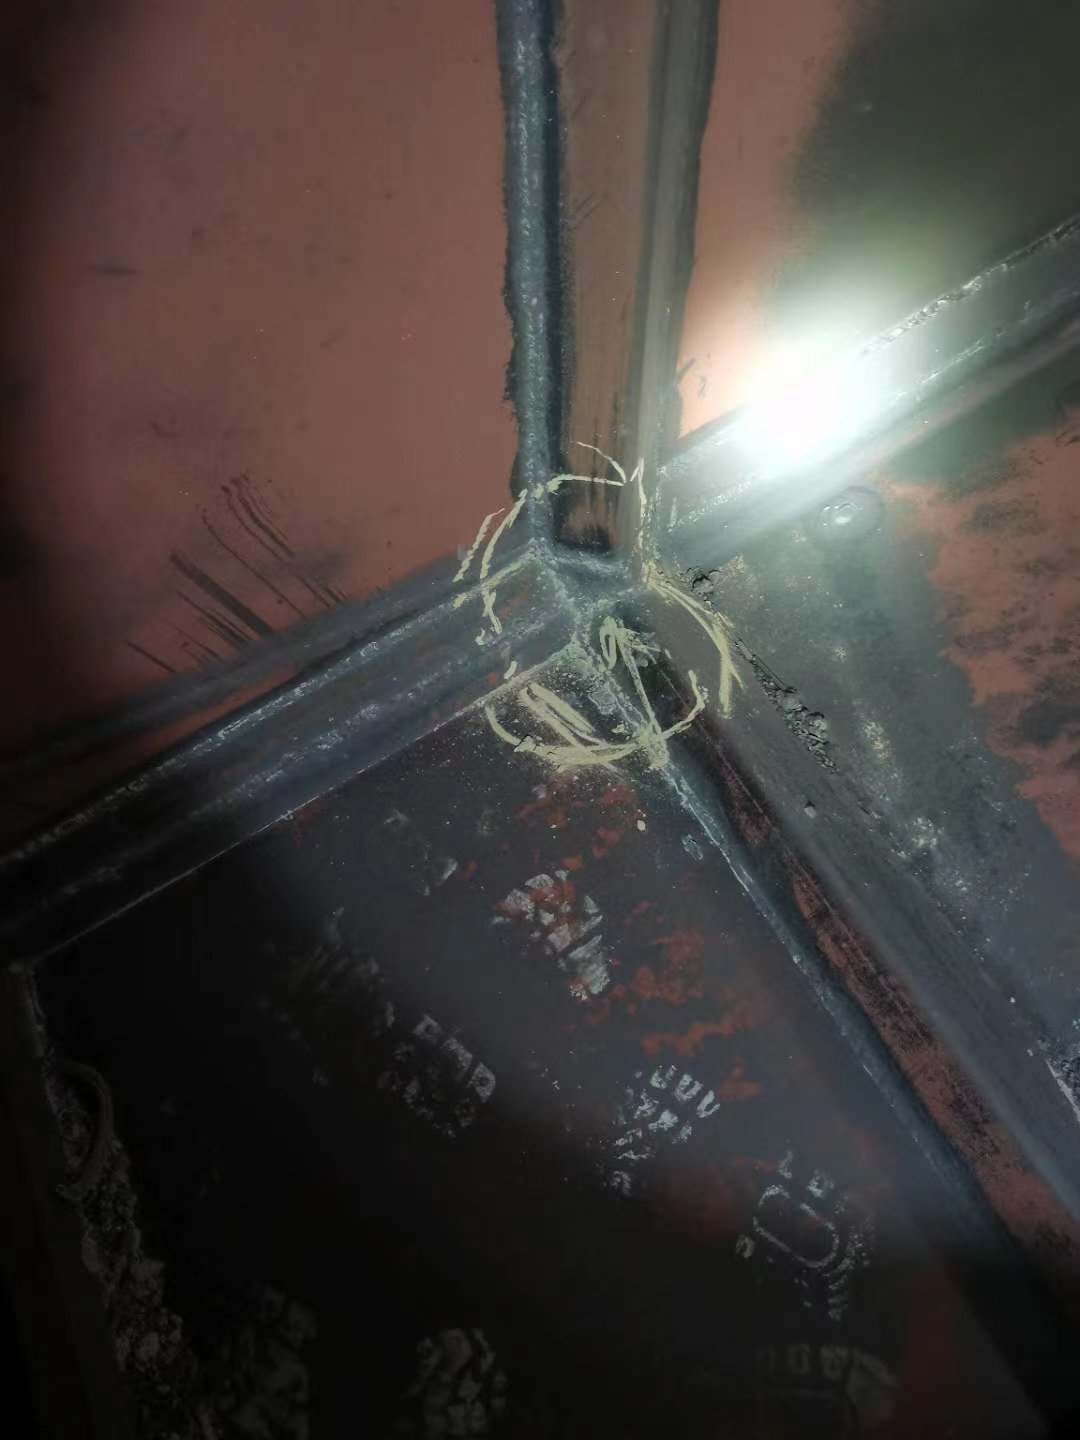
Verified diagnosis
Shutdown inspection confirmed multiple duct leakage points
The subsequent shutdown inspection found several duct leaks, including three identified as principal dust-escape paths. The confirmation supported the field diagnosis that the problem was outside the filter bags.
Corrective direction
Actions tied directly to the evidence
Plan a fluorescent-powder test
Use a controlled tracer test when normal clean-side inspection does not reveal the source of the signal.
Inspect beyond the compartments
Check duct seams, walls, access points and collector-body joints instead of ending the review at the tube sheet.
Mark every suspected point
Photograph and mark leak locations during shutdown so repair and follow-up inspection use the same reference.
Verify after repair
Repeat the operating-state comparison after repairs; the original record confirmed the leak locations but did not document a final post-repair emissions value.
Next shutdown checklist
- Record the monitor response with the raw mill running and stopped.
- Log differential pressure, pulse pressure and cleaning interval together.
- Isolate compartments long enough to observe a stable response.
- Inspect tube-sheet surfaces and clean-side internals for dust tracks.
- Examine duct seams, wall joints, access doors and previous repairs.
- Distinguish a confirmed leak location from an unverified monitoring assumption.
Transferable lesson
Contradictory operating data is often the strongest clue.
If more dust coverage appears to worsen emissions—and chamber checks do not reveal bag leakage—treat the result as a diagnostic signal. Verify the monitor, plan a fluorescent-powder test and inspect duct seams, walls and access points before replacing working filter bags.
Source and confidentiality: The original manufacturing partner’s technical-service record supports the operating conditions and findings. Customer names, sites, dates and identifying images have been removed; only relevant operating conditions, observations and confirmed findings are retained. This is not presented as a Pinnacle Filter direct customer project.
Need a second set of eyes on your baghouse?
Send filter-bag photos, cage details, pressure trend and the operating condition. Pinnacle Filter can help structure the review before a replacement order.